In the recent special issue of the Annals of Glaciology on ‘Glaciology in High Mountain Asia’ our research team contributed four papers focused on the surface of debris-covered Lirung Glacier, located in the Langtang Valley in the Nepalese Himalaya.
Variation in environmental lapse rate
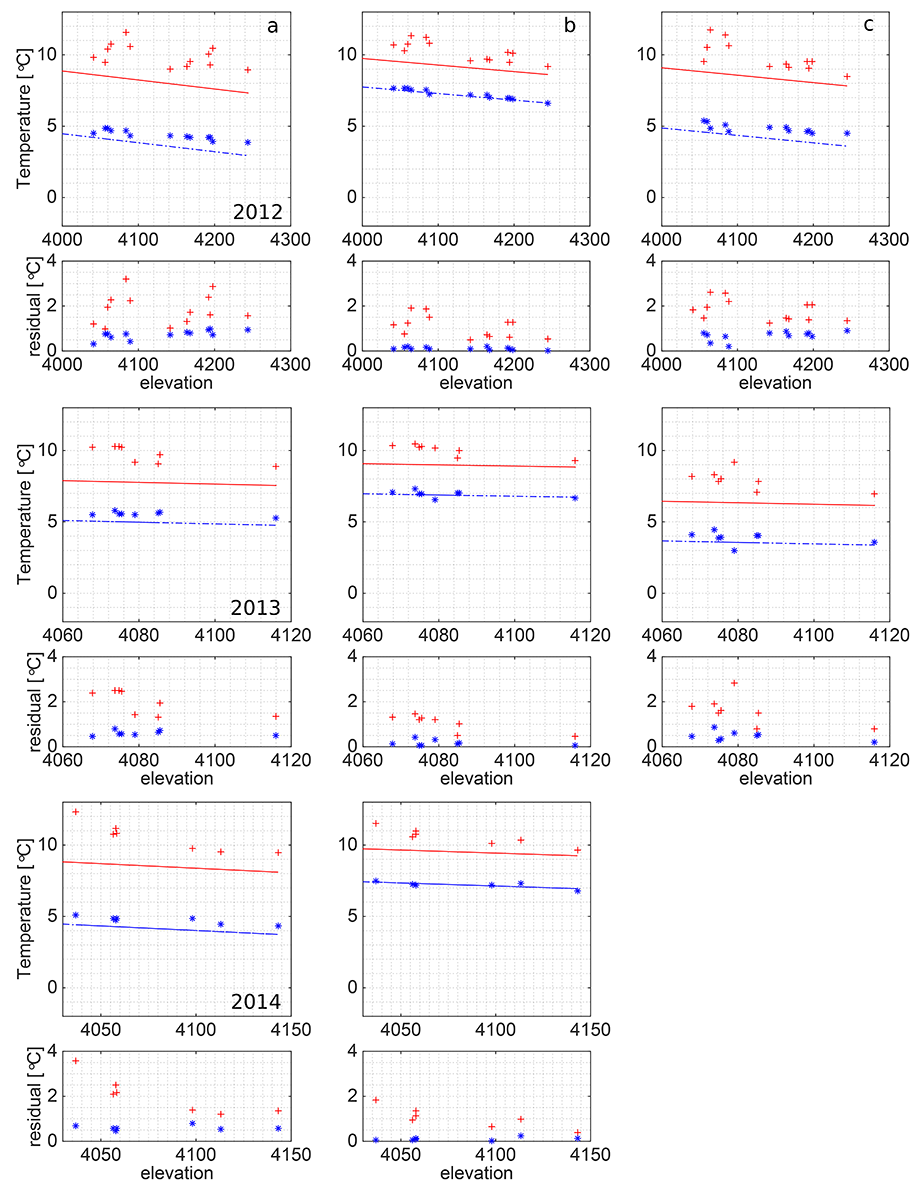
In a study of the distributed air and surface temperature of the debris surface (link) we propose to adapt the normally used environmental lapse rate when using off-glacier data for an energy balance of the glacier, as the debris surface heats up much more than the surrounding environment (Fig. 1). We also show that the lapse rate has a diurnal cycle and the relation between air and surface temperature changes between day and night and for the dry and wet season. This has implications for using surface temperature data acquired from satellite products used to determine local air temperature over a debris covered glacier.
An additional paper looking at the wider catchment (link) shows a strong seasonality of the environmental lapse rate. Lateral variability at transects across valley is high and dominated by aspect, with south-facing sites being warmer than north-facing sites and deviations from the fitted lapse rates of up to several degrees.
Distributed modelling of ice cliffs
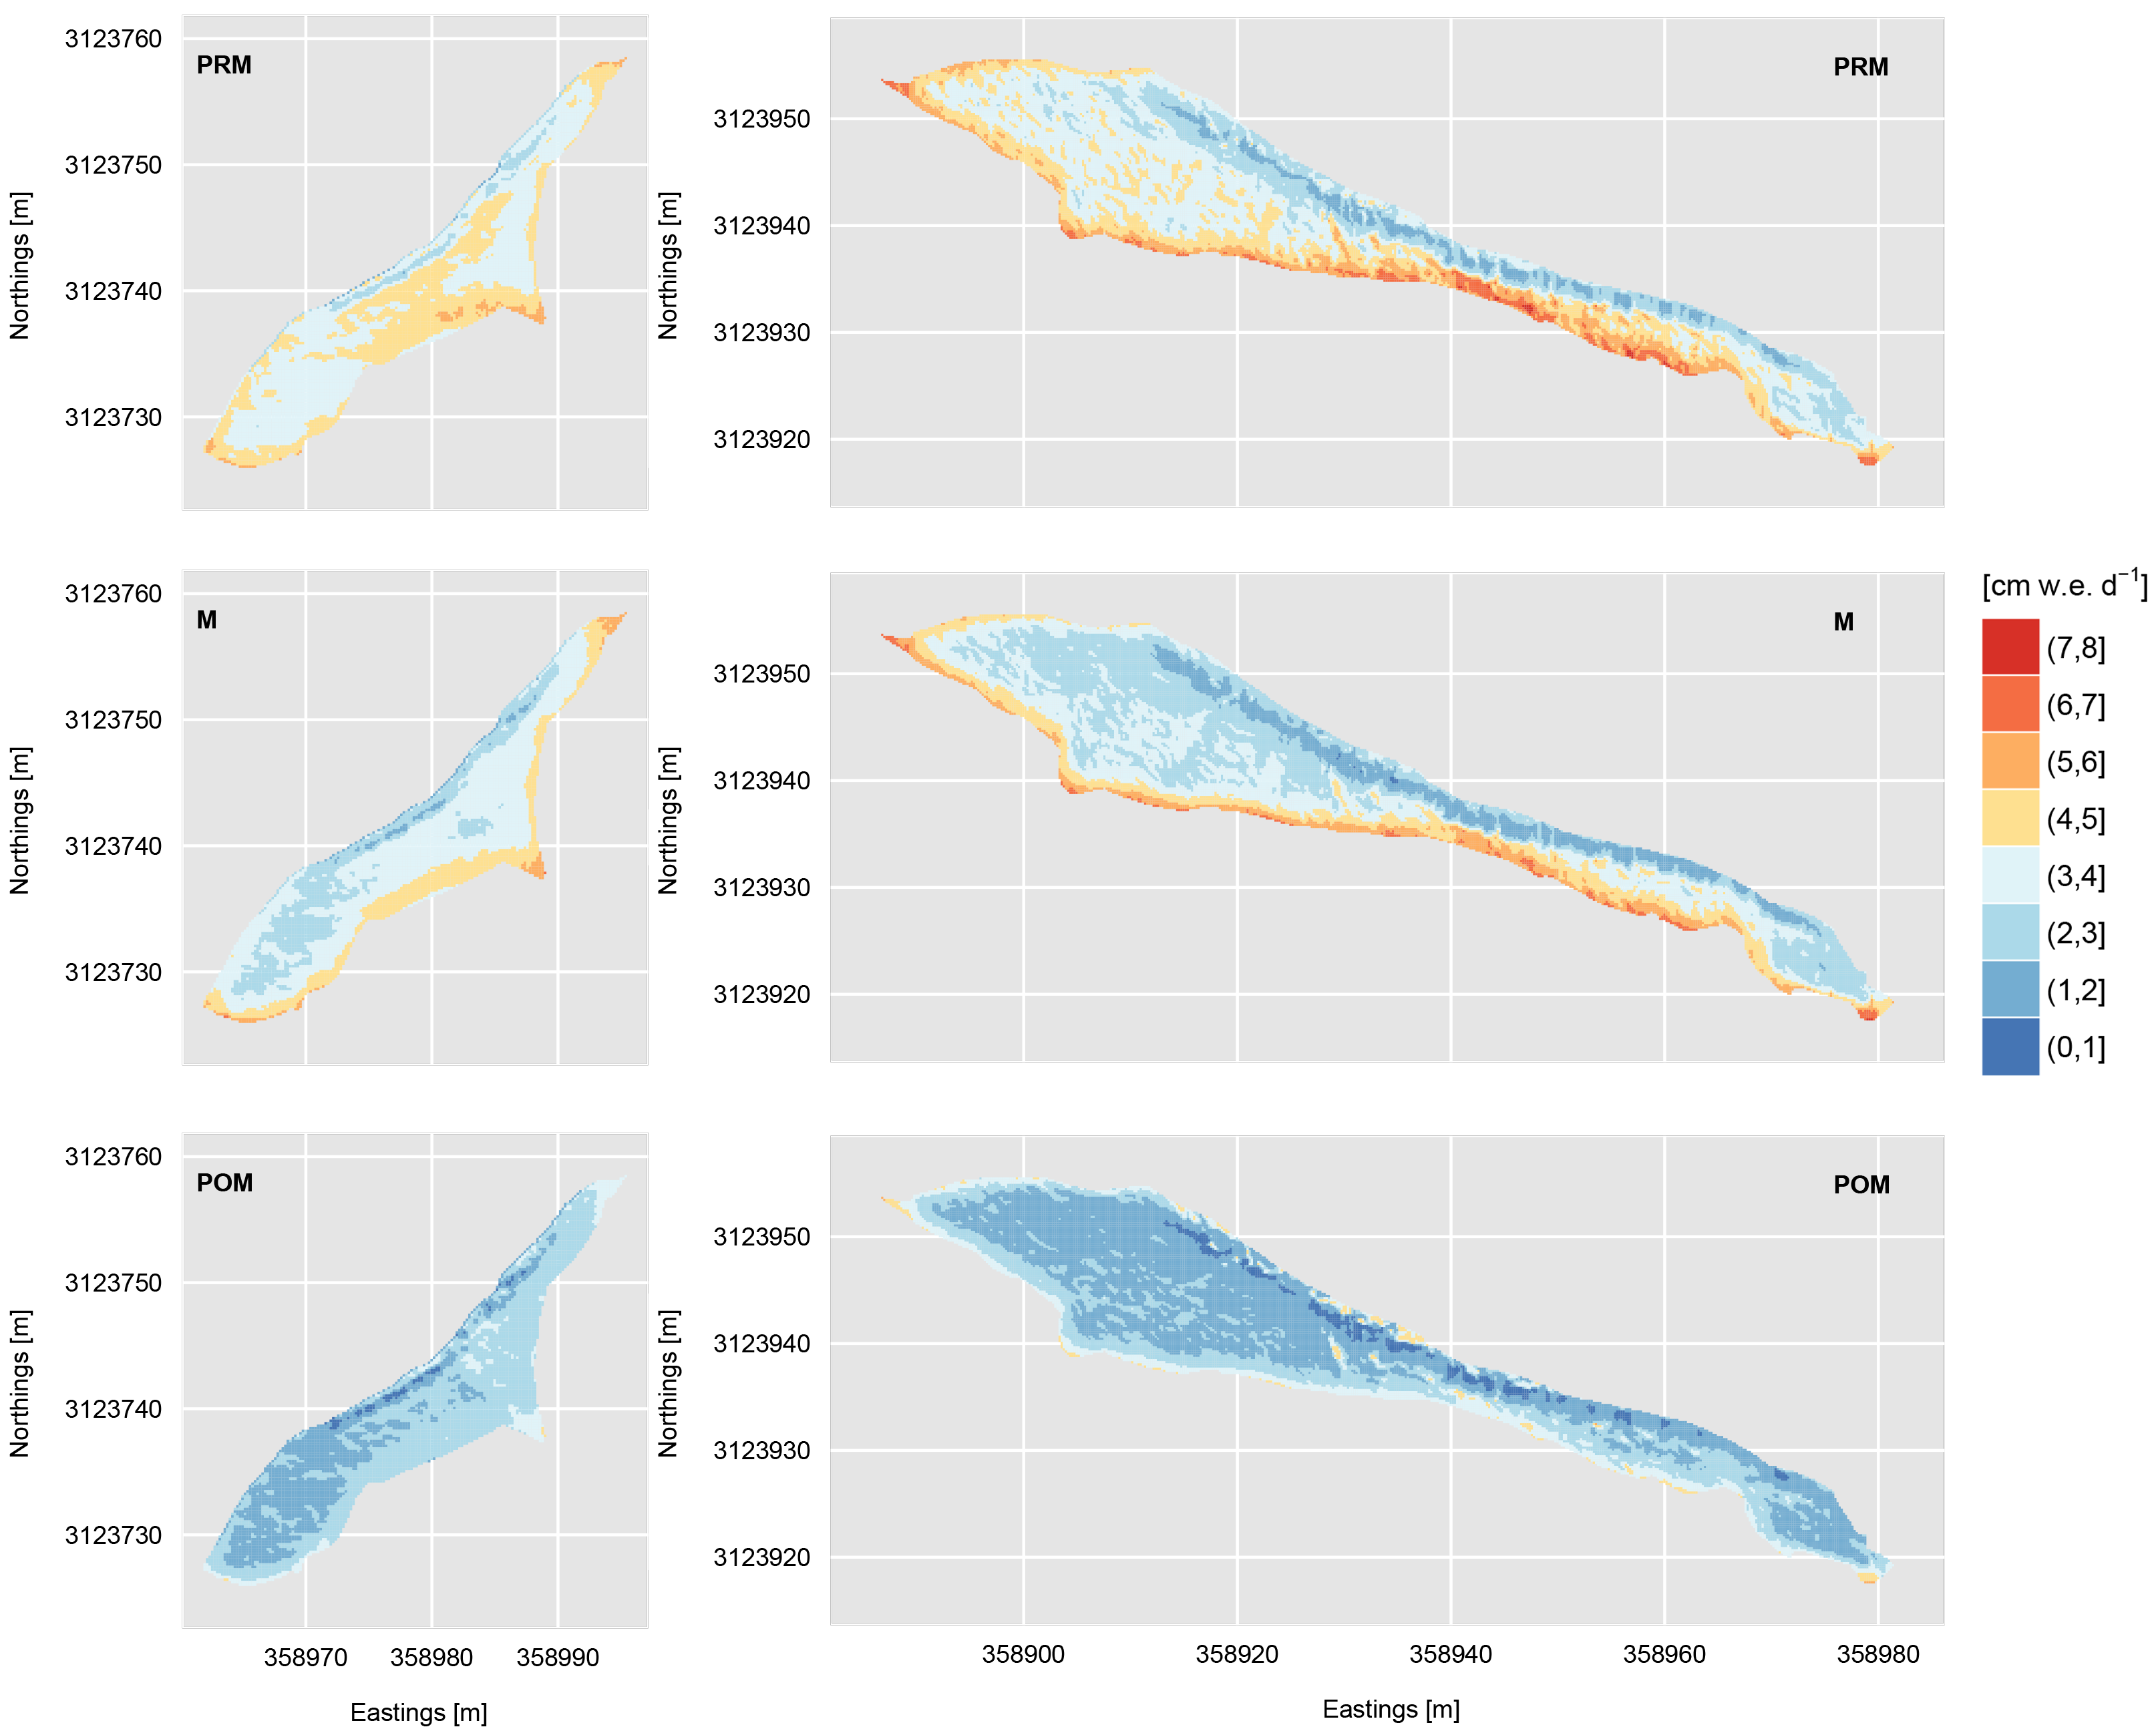
Investigating ice cliffs further (link) we developed a first distributed model of cliff backwasting for two cliffs. The physically-based model includes an improved representation of shortwave and longwave radiation, and their interplay with the glacier topography. Diffuse radiation is the major shortwave component, as the direct component is strongly reduced through self-shading. Incoming longwave radiation is higher than the total incoming shortwave flux, due to radiation emitted by the surrounding terrain. We could show a considerably high variability in melt rates across the cliff surface and ice cliff melt to be more than 10 times higher than melt under debris per unit area (Fig. 2).
Modelling of supraglacial lakes
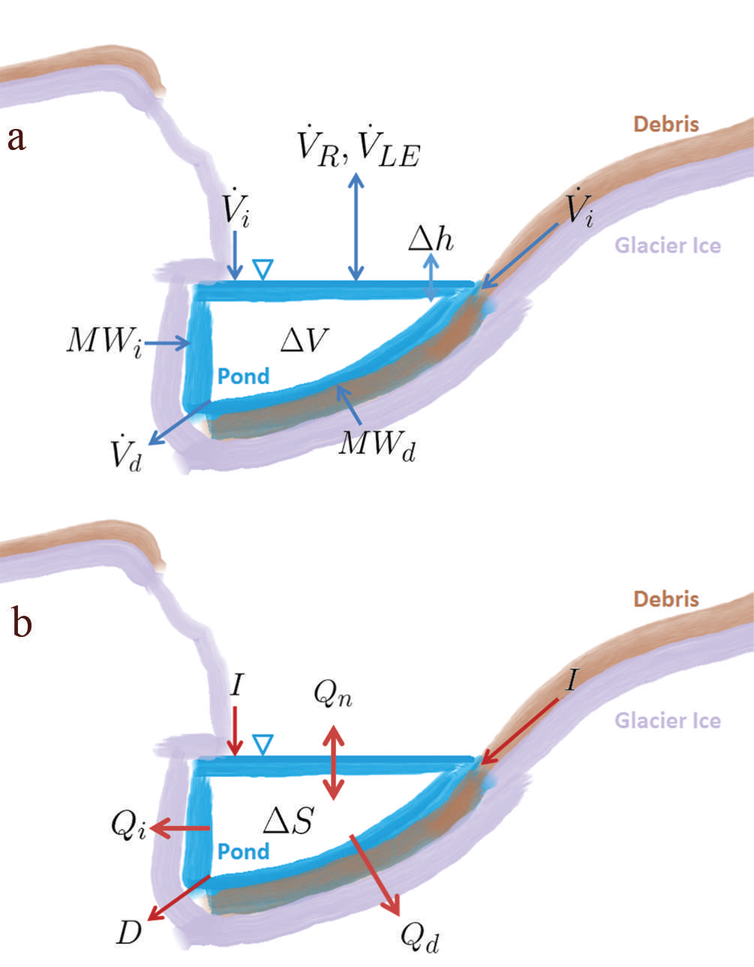
In another study (link) we focus on supraglacial lakes. This research advances previous efforts to develop a model of mass and energy balance for supraglacial ponds by applying a free-convection approach to account for energy exchanges at the subaqueous bare-ice surfaces (Fig. 3). We develop the model using field data from a pond on Lirung Glacier, Nepal, that was monitored during the 2013 and 2014 monsoon periods. Supraglacial ponds efficiently convey atmospheric energy to the glacier’s interior and rapidly promote the downwasting process.
Seasonal surface velocities
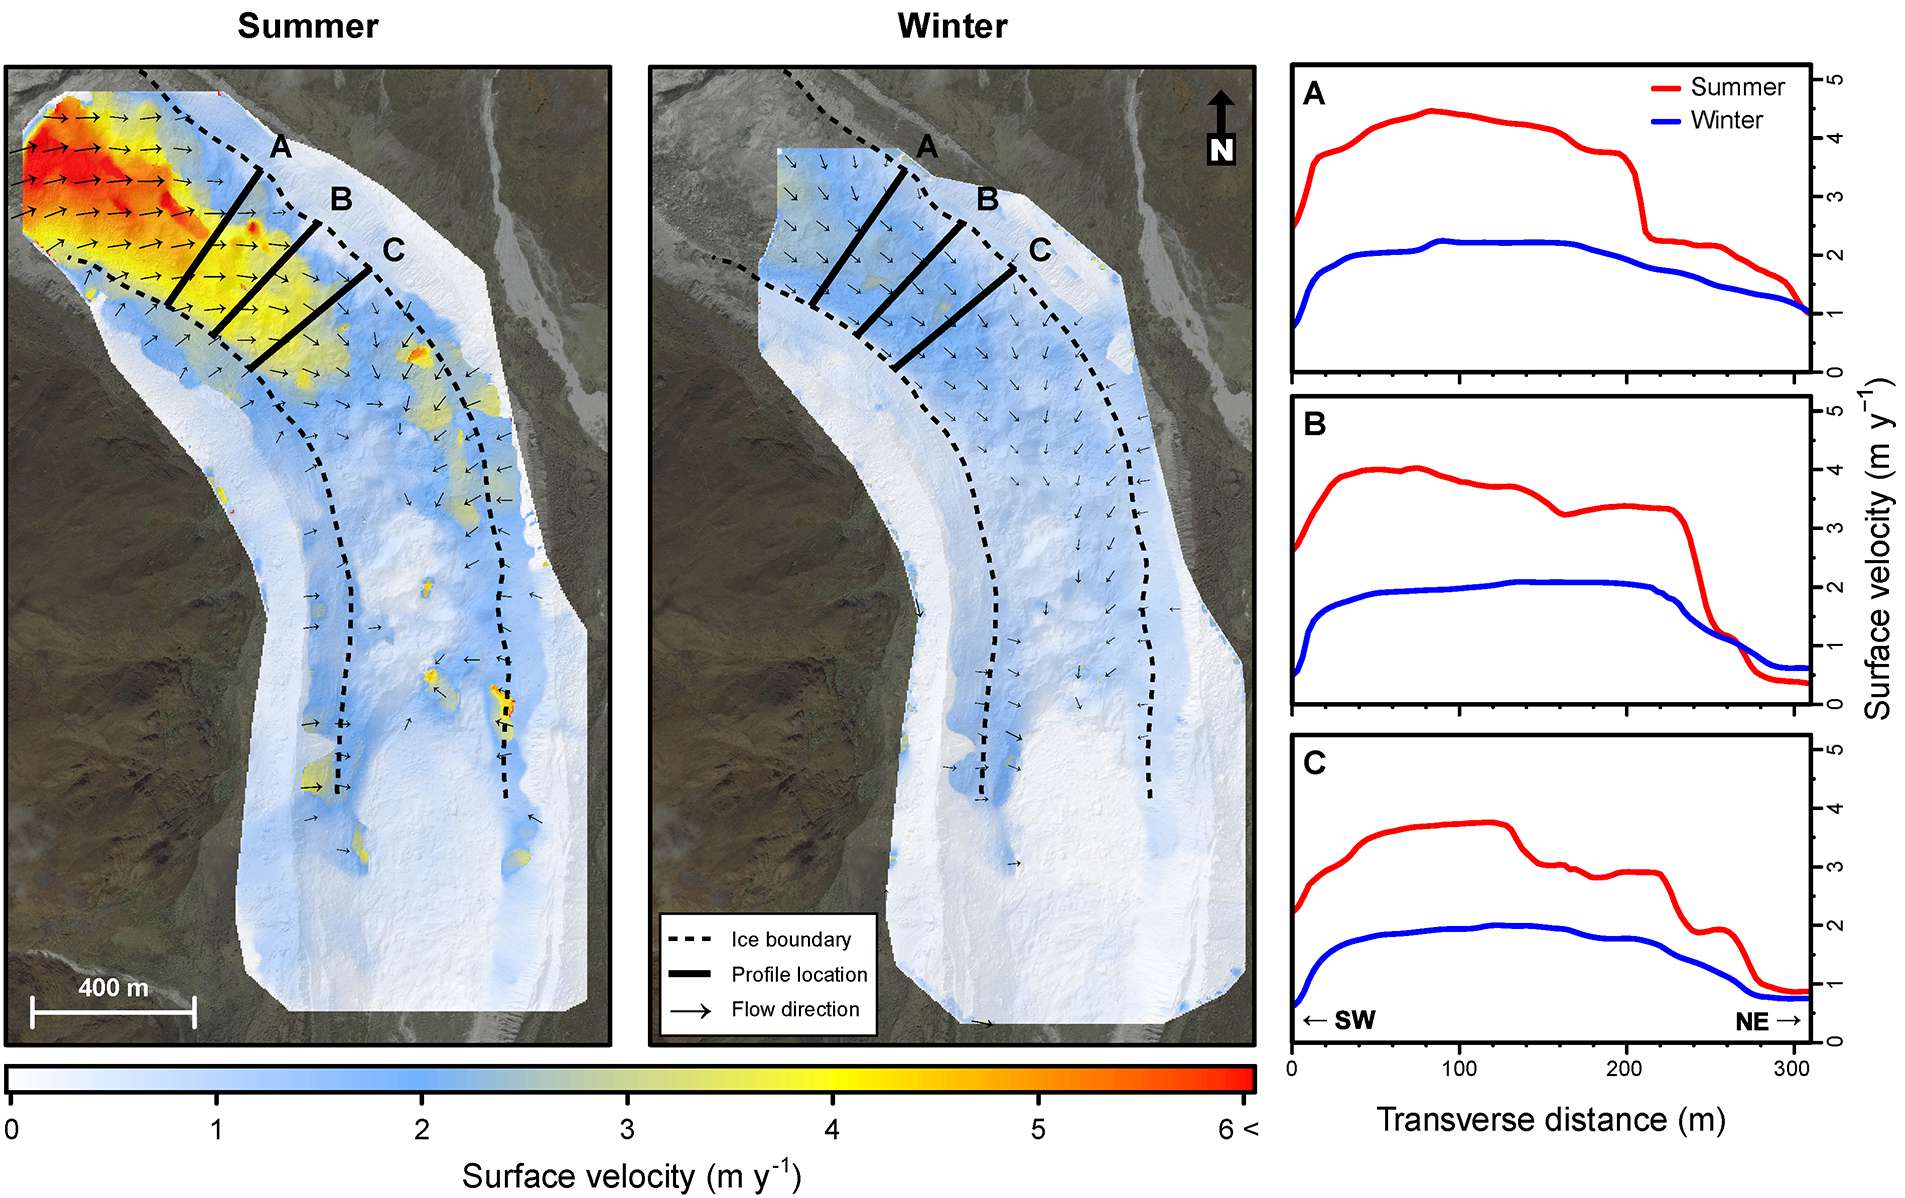
The last study (link) reveals seasonal differences in velocities of Lirung Glacier in detail using cross-correlation feature tracking of imagery from an unmanned aerial vehicle (UAV).The glacier has considerable spatial and seasonal differences in surface velocity, with maximum summer and winter velocities 6 and 2.5 m a–1, respectively, in the upper part of the tongue, while the lower part is nearly stagnant (Fig. 4). UAVs have great potential to quantify seasonal and annual variations in flow and can help to further our understanding of debris-covered glaciers.
![]()
