Glaciers covered by debris – rocks, dirt, silt, and sand – are common in the Himalayas. Depending on who’s counting (and where you are looking), debris covers nearly 25% of the total glacierized area in the region. Experiments and previous studies have shown that really thin debris enhances melt, but that anything over 2 cm thick insulates the ice melt. But what is the net effect of debris cover on glacier melt rates? Our recently published (open access) paper in the Cryosphere tries to answer this question.
Unfortunately, the answer is not so easy to obtain. Traditional mass balance stake measurements are (a) difficult to install and maintain on debris-covered glaciers, and (b) impossibly biased towards locations where it is possible to drill. You could look at surface elevation changes over part of the glacier with either photogrammetry, UAV, or satellite (we use all three), but if you do this you also need to consider the emergence velocity (or increase in elevation) of the glacier as it flows downhill. On any given point in the ablation zone, the total surface elevation change is a function of both emergence and melt. And to estimate the mean emergence velocity, you need to measure the ice flux through a cross-section of the glacier.
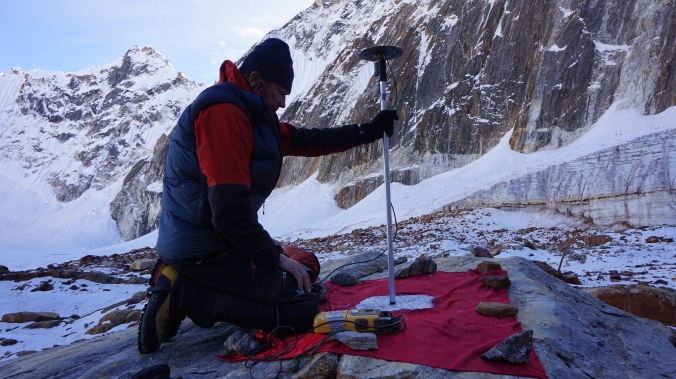
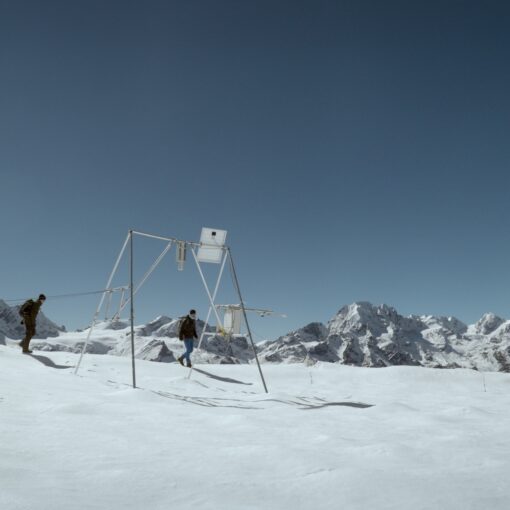
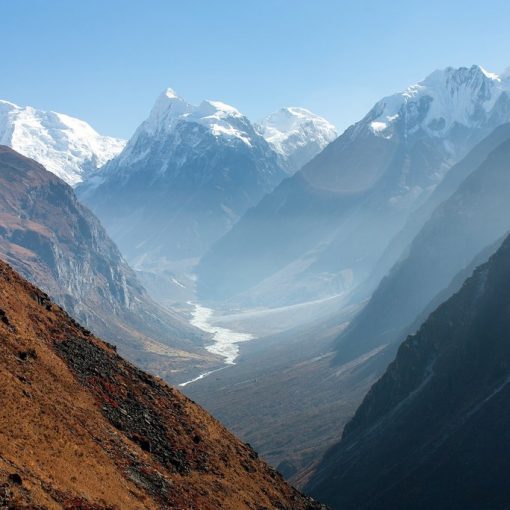
Christian Vincent and Patrick Wagnon, French glaciologists from Laboratoire de Glaciologie et Geophysique (LGGE) and Institut de Recherche pour le Development (IRD), have collected multiple datasets over 4 years to estimate the mass gain and loss over the debris-covered Changri Nup Glacier. I’d remind you that debris-covered glaciers at 5400 m of elevation are not among the easiest places to work.
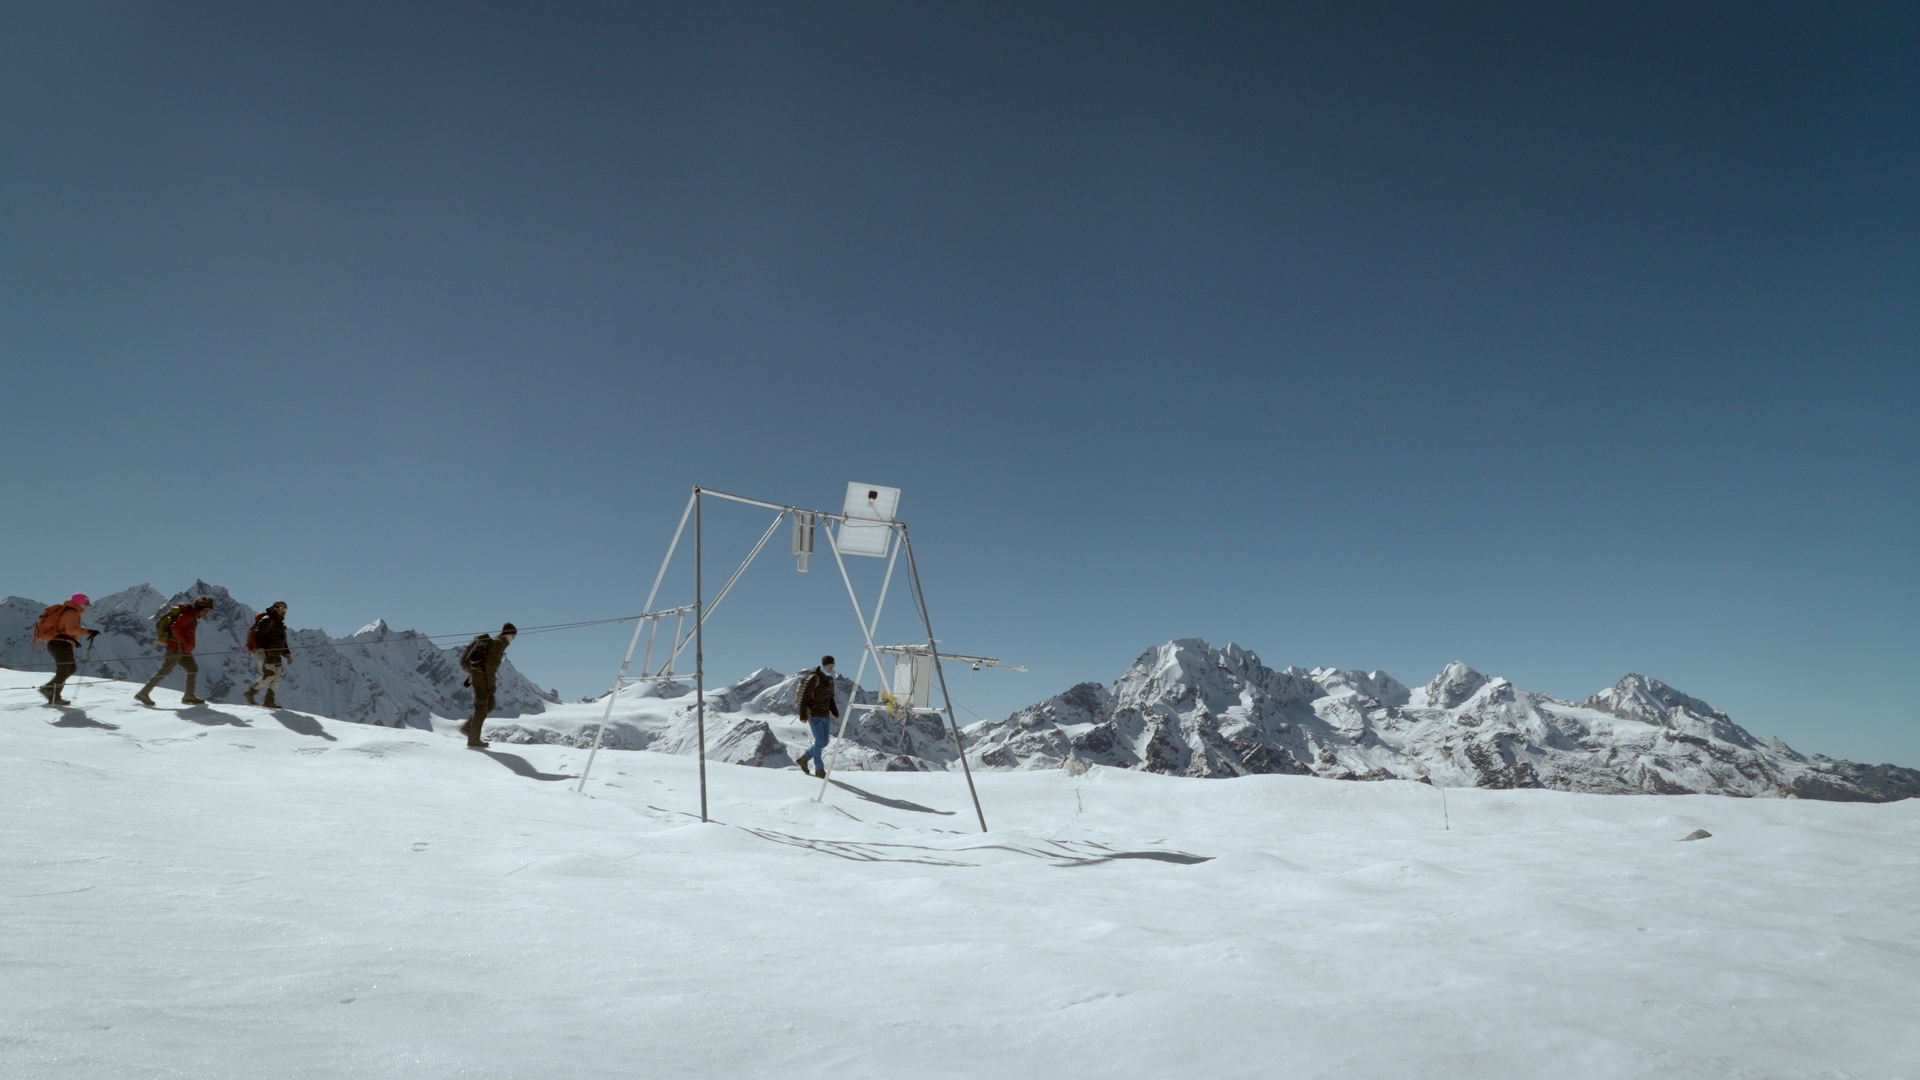
But together with a team of co-authors they have measured surface velocities and surface melt rates with ablation stakes; developed digital elevation models from photogrammetry in 2011 and 2014, from unmanned aerial vehicle surveys in 2015, and from high-resolution satellite data in 2009; measured ice depths with ground-penetrating radar, and mapped ground control points and elevation profiles with differential GPS.
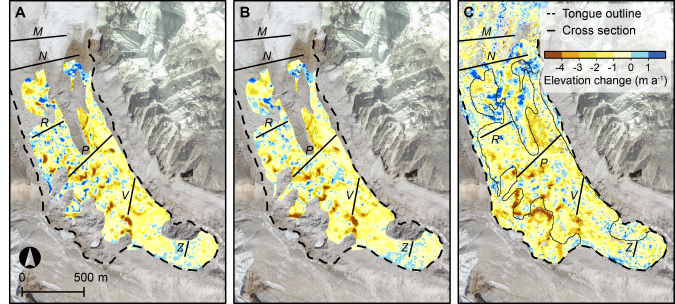
And the overall result: melt rates on the debris-covered glacier are about 60% less than what they would be if the glacier was free of debris. Ice cliffs and ponds enhanced melt locally, but not enough to offset the overall reduction in melt caused by the debris. The surface mass balance (in m of water equivalent, or m w.e.) over the debris-covered tongue, inferred from average surface lowering of -0.81 m w.e./yr and an average emergence velocity of +0.37 m w.e./yr, is -1.21 m w.e./yr. If the glacier were debris-free, we would expect to see an average mass balance rate of -3.00 m w.e./yr.
This field-based study provides strong evidence that the ‘debris-cover anomaly’ (where satellite data show that debris-covered glaciers appear to be lowering at the same rate as clean-ice glaciers) is an artifact. It also shows that, in this location at least, the effects of ponds and ice cliffs are minimal.
Why is this important? If debris-covered ice (low-angle and thick) occupies 25% of the total glacierized area, it probably contains an even greater percentage of the total ice volume. Better estimates of the net insulating effect of debris will help us improve simulations of future ice loss, and its impacts on water resources downstream.
This is a re-post of a recent blog by Joseph M. Shea.
You may also like
A 15-minute AMMODO doc about our research
Master student Kari-Anne studied sources of light-absorbing particles in the Langtang Valley in Nepal.
Science has posted a news item on their website about our research on debris-covered glaciers, following from this upcoming publication: Pellicciotti, F., Stephan, C., […]
A study led by Pleun shows the importance of subkilometer atmospheric modelling and correct surface boundary conditions in areas with complex topography to accurately estimate catchment-scale meteorological variability.